


Consumer electronics retailer Best Buy (NYSE: BBY) stock has been consolidating in a year-long range for a potential breakout as the Company evolves from a pandemic benefactor to a post-pandemic re-opening play.
Free Book Preview
Money-Smart Solopreneur
This book gives you the essential guide for easy-to-follow tips and strategies to create more financial success.
May
11, 2021
5 min read
This story originally appeared on MarketBeat
Consumer electronics retailer Best Buy (NYSE: BBY) stock has been consolidating in a year-long range for a potential breakout as the Company evolves from a pandemic benefactor to a post-pandemic re-opening play. While other technology-related pandemic winners continues to see sell-offs due to concerns of regression back to normal consumer trends with the acceleration of COVID-19 vaccinations, Best Buy has managed to benefit from the continued demand for consumer electronics fueled by the housing boom with the rollout and 5G adoption still ahead. From gaming, computing, accessories, mobility, appliances, home entertainment systems to connected fitness, Best Buy is the one-stop-shop for all things electronic. Investors are wondering how the global chip shortage may have a material impact on its supply chain moving forward. Shares have been resilient and compressing for a range breakout. Prudent investors looking for exposure in consumer electronics end-user demand can monitor shares for opportunistic pullback levels.
Q4 FY fiscal 2021 Earnings Release
On Feb. 25, 2021, Best Buy released its fourth-quarter fiscal 2021 results for the quarter ending January 2020. The Company reported earnings-per-share (EPS) of $3.48 excluding non-recurring items versus consensus analyst estimates for a profit of $2.94, a $0.54 per share beat. Revenues grew 11.5% year-over-year (YoY) to $16.94 billion, beating consensus analyst estimates for $15.27 billion. Enterprise comparable same-store-sales (SSS) rose 12.6% YoY. Domestic comparable online sales rose 89.3% YoY. The Company raised its quarterly dividend to $0.70 per share. Best Buy CEO Corie Barry stated, “Online sales grew almost 90% to a record $6.7 billion and made up 43% of our Domestic sales. Our stores played a pivotal role in the fulfillment of these sales, as almost two-thirds of our online revenue was either picked up in store or curbside, shipped from a store or delivered by a store employee.”
Lowered Fiscal 2022 Guidance
The Company set the bar lower for its FY fiscal 2022 expectations including enterprise comparable growth in the range of (2%) to 1%, online sales representing 40% of domestic sales, enterprise non-GAAP gross profit range below FY 2021 rate of 22%. The Company expects cap-ex of $750 to $850 million and at least $20 billion in share buybacks. For Q1 fiscal 2022, the Company expects enterprise comparable sales growth of approximately 20%. Shares plummeted on the guidance from $113.46 to a low of $95.93 in the following days before staging a sharp rebound.
Conference Call Takeaways
CEO Corie Barry set the tone, “The biggest contributors to the strong comp sales growth in quarter was computing, alliances, gaming, virtual reality and home theatre… Our research indicates our customers look to Best Buy to serve four shopping needs; inspiration, research, convenience and support. And customers expect to seamlessly interact with physical and digital channels. We must be ready to serve all of these needs at all times in all channels. We are building all of our experiences around meeting these needs as we move from big box retailers with a strong omnichannel presence to an omni channel retailer with a large store footprint for support and fulfillment.” This was evidenced by the two-thirds of online orders being fulfilled from a local Best Buy store and 340 stores (35% of all stores) to handle 70% of the fulfillment.
Pandemic-Driven Efficiency
The pandemic resulted in a (-15%) YoY drop in brick-and-mortar retail store traffic. While CEO Corey expects some traffic to return with the re-openings, he believes much of the online shopping trends will remain permanent. This had led to Best Buy rethinking retail space, “We believe that we can achieve similar results consolidating volume, using a smaller group of stores as hubs over time. In addition, in a subset of these stores, we plan to reduce the sales floor square footage and install warehouse grade packaging station equipment and supplies. As a result, we expect to drive both efficiency and effectiveness.” The Company is already piloting reduced selling square footage and experimenting with alternate store layouts to grow efficiencies. “We will continue our normal review process, which involves putting stores through rigorous evaluations as their leases come up for renewal.”, noted CEO Barry reminding investors the Company has already closed 20 large format stores in the past two years as a result.
BBY Opportunistic Pullback Price Levels
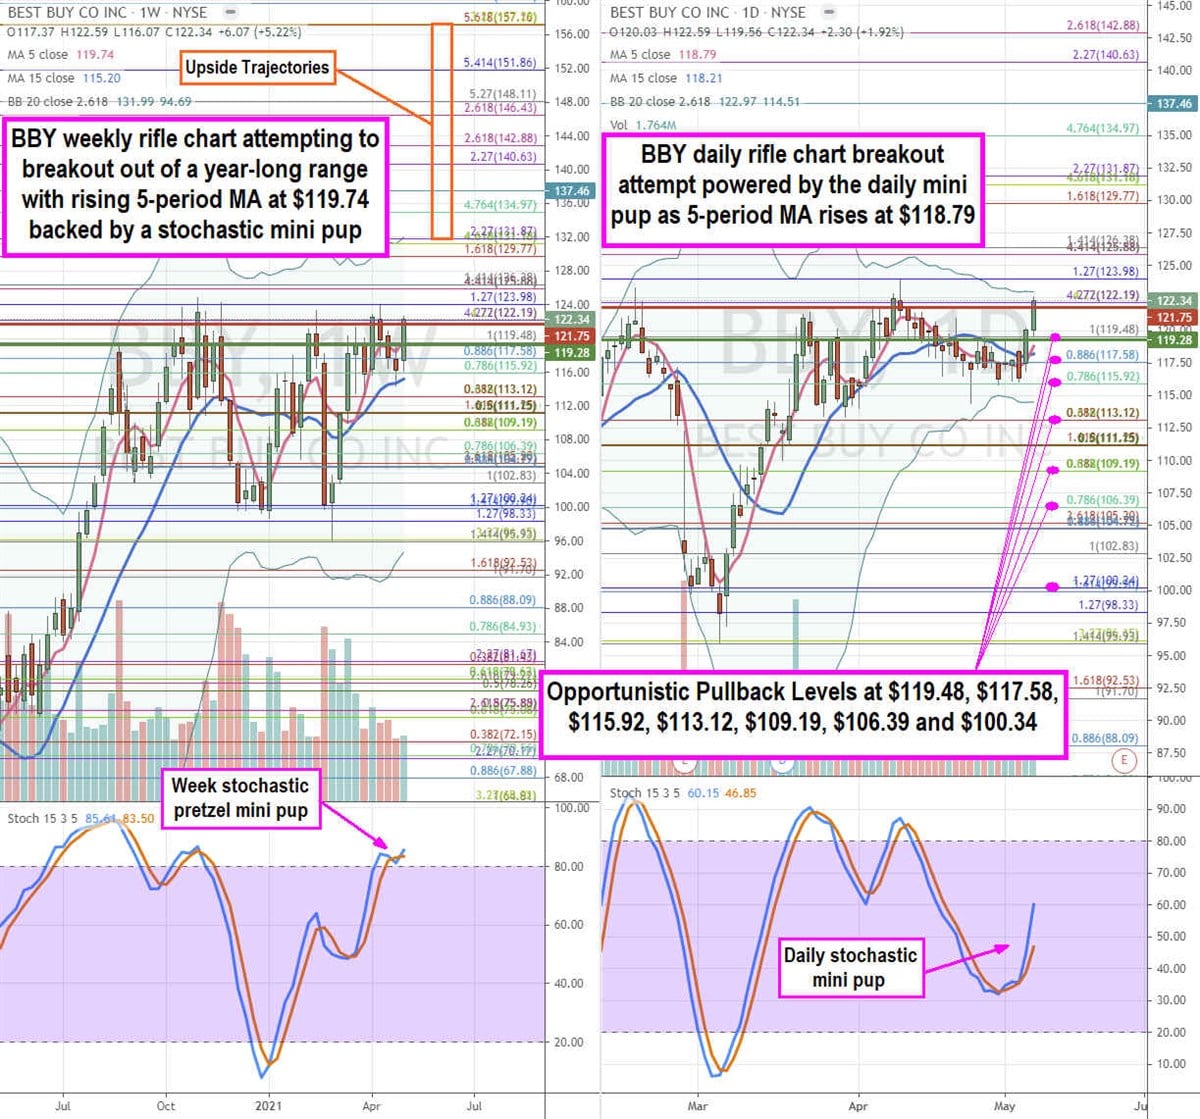
Using the rifle charts on the weekly and daily time frames provides a precision view of the landscape for BBY stock. The weekly rifle chart shows a year-long range with upside resistance that deflected five breakout attempts at the $123.98 Fibonacci (fib) level. This formed weekly market structure high (MSH) trigger below $121.75. The weekly 5-period moving average (MA) is at $119.74 as the weekly stochastic formed a pretzel mini pup and moving average pup breakout. A pretzel stochastic forms when the stochastic initially crosses down but then spikes back up causing short-sellers to cover frantically. This is a sixth attempt for a range breakout. The daily rifle chart breakout has a rising 5-period MA at the $118.79 powered by a stochastic mini pup through the 60-band. The daily breakout formed on the daily market structure low (MSL) breakout through $119.28. The daily upper Bollinger Bands (BBs) sit at $122.97. The daily BBs have been in a compression which precedes a range expansion. Prudent investors can watch for opportunistic pullback levels at the $119.48, $117.58 fib, $115.92 fib, $113.12 fib, $109.19 fib, $106.39 fib, and the $100.34 fib. Upside trajectories range from the $131.87 fib up to the $157.16 fib.
Featured Article: Closed-End Mutual Funds (CEFs)